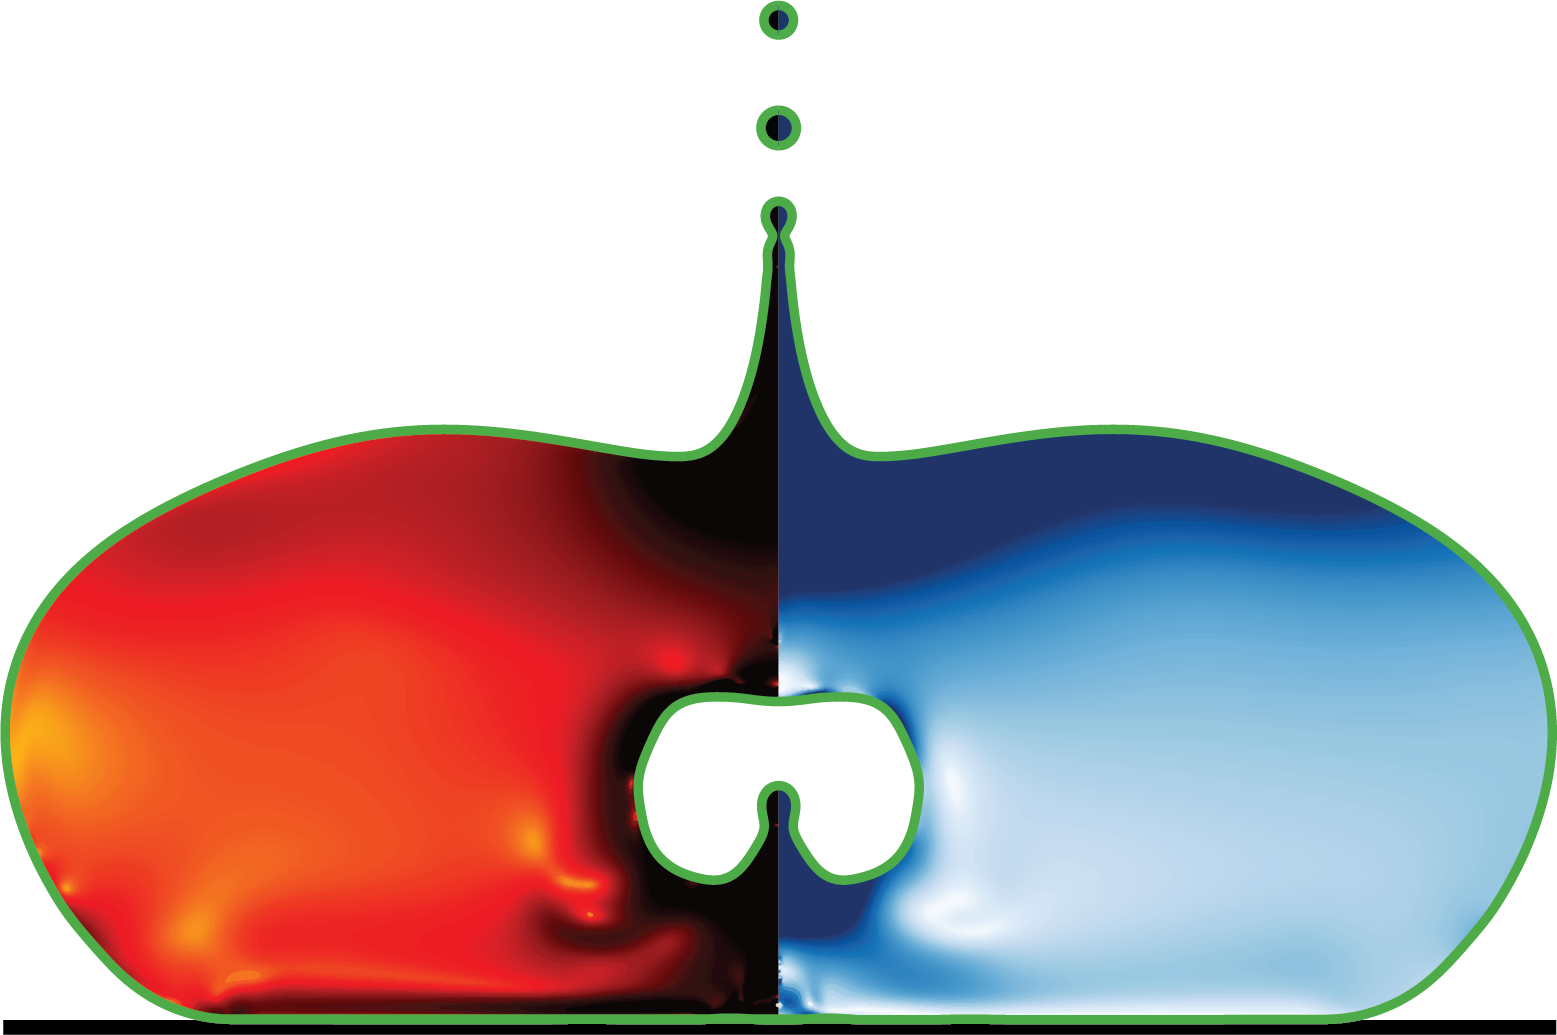
# Author: Vatsal Sanjay
# [email protected]
# Physics of Fluids
# Last updated: Dec 24, 2024

import numpy as np
import os
import subprocess as sp
import matplotlib
matplotlib.use('Agg')  # Use non-interactive backend
import matplotlib.pyplot as plt
from matplotlib.collections import LineCollection
from matplotlib.ticker import StrMethodFormatter
import multiprocessing as mp
from functools import partial
import argparse

import matplotlib.colors as mcolors
custom_colors = ["white", "#DA8A67", "#A0522D", "#400000"]
custom_cmap = mcolors.LinearSegmentedColormap.from_list("custom_hot", custom_colors)

# Set up matplotlib configuration
plt.rcParams['text.usetex'] = True
plt.rcParams['font.family'] = 'serif'
plt.rcParams['text.latex.preamble'] = r'\usepackage{amsmath}\usepackage{amssymb}'
plt.rcParams['mathtext.fontset'] = 'cm'
plt.rcParams['font.serif'] = ['Computer Modern Roman'] + plt.rcParams['font.serif']

def gettingFacets(filename):
    exe = ["./getFacets", filename]
    p = sp.Popen(exe, stdout=sp.PIPE, stderr=sp.PIPE)
    stdout, stderr = p.communicate()
    temp1 = stderr.decode("utf-8")
    temp2 = temp1.split("\n")
    segs = []
    skip = False
    if (len(temp2) > 1e2):
        for n1 in range(len(temp2)):
            temp3 = temp2[n1].split(" ")
            if temp3 == ['']:
                skip = False
                pass
            else:
                if not skip:
                    temp4 = temp2[n1+1].split(" ")
                    r1, z1 = np.array([float(temp3[1]), float(temp3[0])])
                    r2, z2 = np.array([float(temp4[1]), float(temp4[0])])
                    segs.append(((r1, z1),(r2, z2)))
                    segs.append(((-r1, z1),(-r2, z2)))
                    skip = True
    return segs

def gettingfield(filename, zmin, rmin, zmax, rmax, nr):
    exe = ["./getData", filename, str(zmin), str(rmin), str(zmax), str(rmax), str(nr)]
    p = sp.Popen(exe, stdout=sp.PIPE, stderr=sp.PIPE)
    stdout, stderr = p.communicate()
    temp1 = stderr.decode("utf-8")
    temp2 = temp1.split("\n")
    # print(temp2) #debugging
    Rtemp, Ztemp, D2temp, veltemp  = [],[],[],[]

    for n1 in range(len(temp2)):
        temp3 = temp2[n1].split(" ")
        if temp3 == ['']:
            pass
        else:
            Ztemp.append(float(temp3[0]))
            Rtemp.append(float(temp3[1]))
            D2temp.append(float(temp3[2]))
            veltemp.append(float(temp3[3]))


    R = np.asarray(Rtemp)
    Z = np.asarray(Ztemp)
    D2 = np.asarray(D2temp)
    vel = np.asarray(veltemp)

    nz = int(len(Z)/nr)

    # print("nr is %d %d" % (nr, len(R))) # debugging
    print("nz is %d" % nz)

    R.resize((nz, nr))
    Z.resize((nz, nr))
    D2.resize((nz, nr))
    vel.resize((nz, nr))

    return R, Z, D2, vel, nz

# ----------------------------------------------------------------------------------------------------------------------

def process_timestep(ti, caseToProcess, folder, nGFS, GridsPerR, rmin, rmax, zmin, zmax, lw):
    t = 0.01 * ti
    place = f"{caseToProcess}/intermediate/snapshot-{t:.4f}"
    name = f"{folder}/{int(t*1000):08d}.png"

    if not os.path.exists(place):
        print(f"{place} File not found!")
        return

    if os.path.exists(name):
        print(f"{name} Image present!")
        return

    # --- Gather interface segments and field data as before ---
    segs = gettingFacets(place)
    nr = int(GridsPerR * rmax)
    R, Z, D2, vel, nz = gettingfield(place, zmin, rmin, zmax, rmax, nr)


    [xminp, xmaxp, yminp, ymaxp] = R.min(), R.max(), Z.min(), Z.max()
    extent_vel = [-xminp, -xmaxp, yminp, ymaxp]
    extent_D2 = [xminp, xmaxp, yminp, ymaxp]

    AxesLabel, TickLabel = 30, 20
    fig, ax = plt.subplots(1, 1, figsize=(19.20, 10.80))


    ax.plot([-rmax, rmax], [0, 0], '--', color='grey', linewidth=lw)  # "horizontal" axis is z
    ax.plot([0, 0], [zmin, zmax], '-.', color='grey', linewidth=lw)  # "vertical" axis is r

    # Domain box:
    ax.plot([-rmax, rmax], [zmin, zmin], '-', color='black', linewidth=lw)
    ax.plot([-rmax, rmax], [zmax, zmax], '-', color='black', linewidth=lw)
    ax.plot([-rmax, -rmax], [zmin, zmax], '-', color='black', linewidth=lw)
    ax.plot([rmax, rmax], [zmin, zmax], '-', color='black', linewidth=lw)

    line_segments = LineCollection(segs, linewidths=4, colors='green')
    ax.add_collection(line_segments)

    # ----------------------------------------------------------
    # Now show imshow with the rotated arrays and extents:
    # ----------------------------------------------------------
    cntrl1 = ax.imshow(
        vel,
        cmap="Blues",
        interpolation='bilinear',
        origin='lower',
        extent=extent_vel,
        vmin=0.0,
        vmax=4e0
    )
    cntrl2 = ax.imshow(
        D2,
        cmap="hot_r",
        interpolation='bilinear',
        origin='lower',
        extent=extent_D2,
        vmin=-3e0,
        vmax=2e0
    )

    # Equal aspect ensures squares in the new orientation
    ax.set_aspect('equal')
    ax.set_xlim(-rmax, rmax)  # x range
    ax.set_ylim(zmin, zmax)  # y range

    # Titles and labels that match the new orientation
    ax.set_title(fr'$t/\tau_{{\gamma}} = {t:.4f}$', fontsize=TickLabel)

    # Colorbars: place them closer to the plot edges
    fig.subplots_adjust(left=0.1, right=0.9)  # adjust spacing for vertical colorbars

    # Left colorbar
    cbar_ax1 = fig.add_axes([0.07, 0.15, 0.02, 0.7])   # x,y,width,height in figure coords
    c1 = plt.colorbar(cntrl1, cax=cbar_ax1, orientation='vertical')
    c1.ax.tick_params(labelsize=TickLabel)
    c1.set_label(r'$\|u_i\|/V_{\gamma}$', fontsize=AxesLabel, labelpad=10, rotation=90, position=(0,0.5))
    c1.ax.yaxis.set_label_position('left')
    c1.ax.yaxis.set_ticks_position('left')  # Move ticks to left side
    c1.ax.tick_params(axis='y', labelright=False, labelleft=True)  # Move tick labels to left side

    # Right colorbar
    cbar_ax2 = fig.add_axes([0.92, 0.15, 0.02, 0.7])
    c2 = plt.colorbar(cntrl2, cax=cbar_ax2, orientation='vertical')
    c2.ax.tick_params(labelsize=TickLabel)
    c2.set_label(r'$\|\mathcal{D}_{ij}\|\tau_{\gamma}$', fontsize=AxesLabel, labelpad=10)

    ax.axis('off')

    # Save with higher DPI and specific backend
    plt.savefig(name, bbox_inches="tight", dpi=150, backend='agg')
    plt.close()

def main():
    # Get number of CPUs from command line argument, or use all available
    import argparse

    parser = argparse.ArgumentParser()
    parser.add_argument('--CPUs', type=int, default=mp.cpu_count(), help='Number of CPUs to use')
    parser.add_argument('--nGFS', type=int, default=256, help='Number of restart files to process')

    parser.add_argument('--ZMAX', type=float, default=1.0, help='Maximum Z value')
    parser.add_argument('--RMAX', type=float, default=4.0, help='Maximum R value')
    parser.add_argument('--ZMIN', type=float, default=-3.0, help='Minimum Z value')
    parser.add_argument('--RMIN', type=float, default=0.0, help='Minimum R value')
    parser.add_argument('--caseToProcess', type=str, default='../testCases/burstingBubbleHB', help='Case to process')

    args = parser.parse_args()

    CPUStoUse = args.CPUs
    nGFS = args.nGFS
    ZMAX = args.ZMAX
    RMAX = args.RMAX
    ZMIN = args.ZMIN
    RMIN = args.RMIN
    caseToProcess = args.caseToProcess
    num_processes = CPUStoUse

    rmin, rmax, zmin, zmax = [RMIN, RMAX, ZMIN, ZMAX]
    GridsPerR = 128

    lw = 2
    folder = 'Video'

    if not os.path.isdir(folder):
        os.makedirs(folder)

    # Create a pool of worker processes
    with mp.Pool(processes=num_processes) as pool:
        # Create partial function with fixed arguments
        process_func = partial(process_timestep, caseToProcess=caseToProcess,
                             folder=folder, nGFS=nGFS,
                             GridsPerR=GridsPerR, rmin=rmin, rmax=rmax,
                             zmin=zmin, zmax=zmax, lw=lw)
        # Map the process_func to all timesteps
        pool.map(process_func, range(nGFS))

if __name__ == "__main__":
    main()