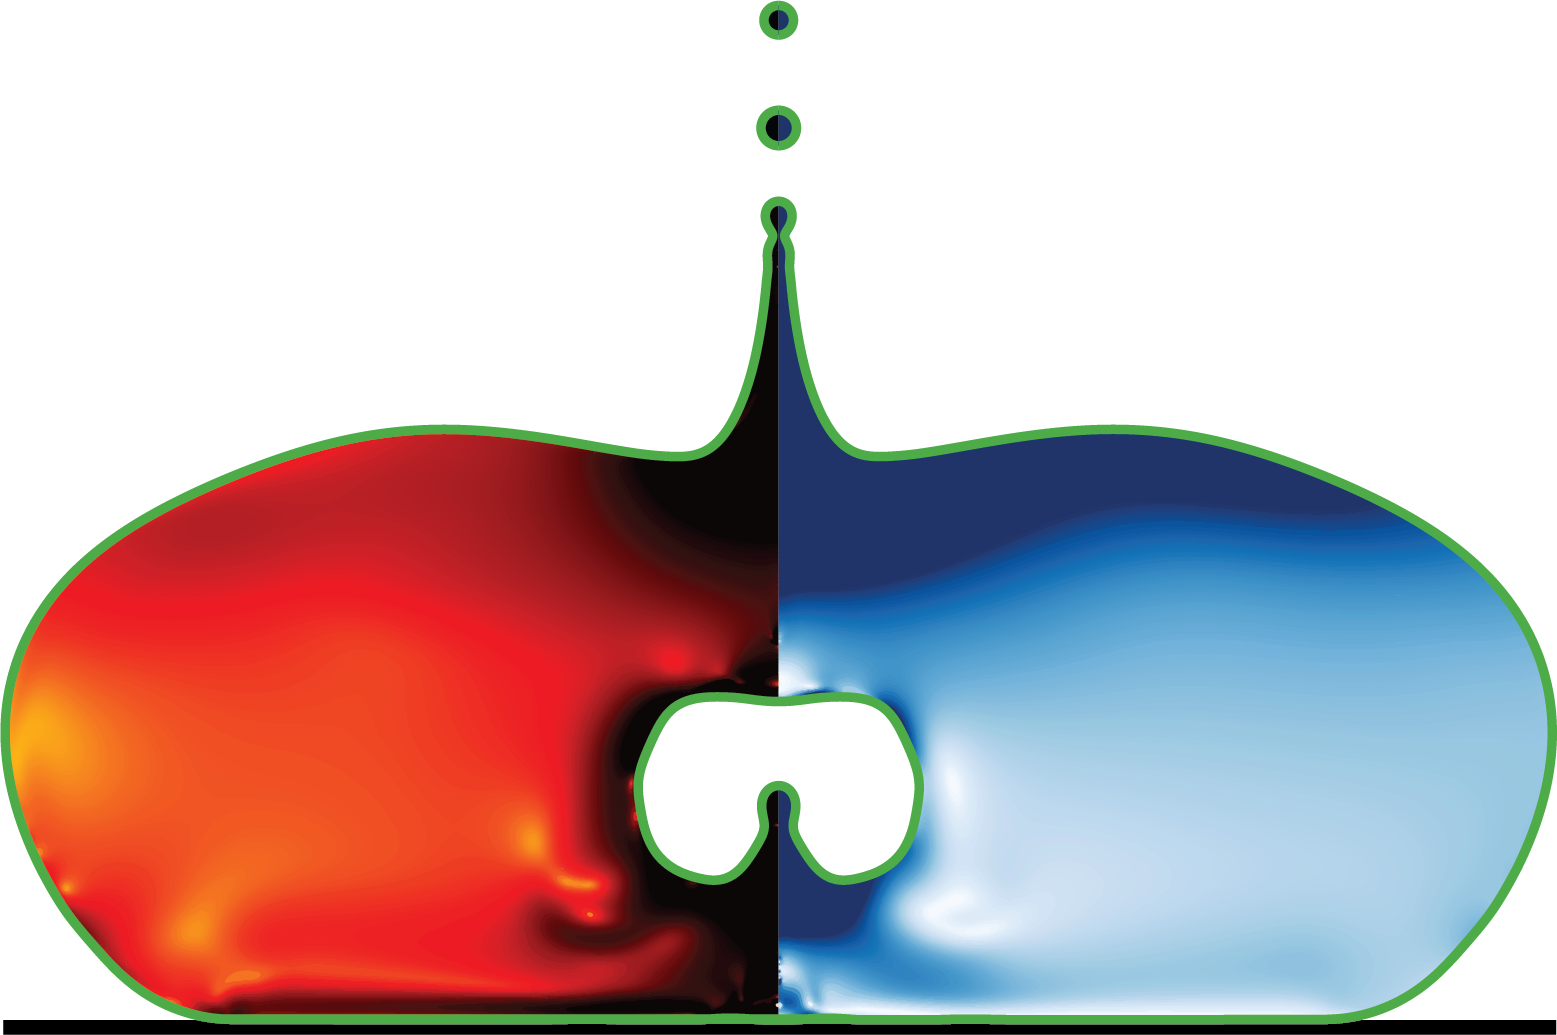
postProcess/Video-generic.py
# Author: Vatsal Sanjay
# [email protected]
# CoMPhy Lab
# Durham University
# Last updated: Nov 17, 2025
Generic video post-processing pipeline for Basilisk drop-impact runs.
Overview
The helper executables
postProcess/getFacet and
postProcess/getData-generic are compiled as
part of the Basilisk workflow. This Python wrapper
shells out to those binaries for every snapshot,
reshapes the returned grids, and renders angularly
mirrored visualisations. Keeping everything in a
mono-file but with concrete building blocks mirrors the
literate C/H style described in CLAUDE.md and keeps the
documentation tooling
(.github/scripts/build.sh) happy.
Usage
Typical invocation from the repository root::
python3 postProcess/Video-generic.py --caseToProcess simulationCases/1234/resultsCommand-line switches expose all relevant knobs (grid density, domain limits, time stride, CPU count). The output directory is created on-demand and filled with zero-padded PNG files compatible with downstream stitching utilities.
import argparse
import multiprocessing as mp
import os
import subprocess as sp
from dataclasses import dataclass
from functools import partial
from datetime import datetime
from typing import Sequence, Tuple

import matplotlib
import matplotlib.pyplot as plt
import numpy as np
from matplotlib.collections import LineCollection
from matplotlib.ticker import StrMethodFormatter

# Configure matplotlib with mathtext (parallel-safe, no external LaTeX)
matplotlib.rcParams["font.family"] = "serif"
matplotlib.rcParams["mathtext.fontset"] = "cm"  # Computer Modern style


@dataclass(frozen=True)
class DomainBounds:
Symmetry-aware domain description in cylindrical coordinates.
The code expects r in [rmin, rmax] with rmin <= 0 to leverage the axis of symmetry; z spans freely between zmin and zmax. Packaging these values avoids argument soup when plotting or generating overlays.
    rmin: float
    rmax: float
    zmin: float
    zmax: float


@dataclass(frozen=True)
class RuntimeConfig:
Run-time knobs collected from CLI arguments.
Multiprocessing workers only need a single instance of this struct, making later CLI additions painless. The accessors keep mirror operations (e.g., computing rmin) in one place.
    cpus: int
    n_snapshots: int
    grids_per_r: int
    tsnap: float
    zmin: float
    zmax: float
    rmax: float
    case_dir: str
    output_dir: str
    skip_video_encode: bool
    framerate: int
    output_fps: int

    @property
    def rmin(self) -> float:
        return -self.rmax

    @property
    def bounds(self) -> DomainBounds:
        return DomainBounds(self.rmin, self.rmax, self.zmin, self.zmax)


@dataclass(frozen=True)
class PlotStyle:
Single source of truth for plot-level choices.
Matplotlib tweaks become traceable: alter colours, fonts, or geometry here and every rendered frame will stay consistent without touching plotting logic.
    figure_size: Tuple[float, float] = (19.20, 10.80)
    tick_label_size: int = 20
    zero_axis_color: str = "grey"
    axis_color: str = "black"
    line_width: float = 2.0
    interface_color: str = "#00B2FF"
    colorbar_width: float = 0.03
    left_colorbar_offset: float = 0.04
    right_colorbar_offset: float = 0.01


@dataclass(frozen=True)
class SnapshotInfo:
Metadata for an input snapshot and its output image.
Storing paths and the physical time together simplifies filename logic and ensures logging statements stay informative.
    index: int
    time: float
    source: str
    target: str


@dataclass
class FieldData:
Structured holder around the grids returned by getData-generic.
Attributes provide convenient min/max queries so the plotting routine does not need to recalculate extents or worry about array shapes.
    R: np.ndarray
    Z: np.ndarray
    strain_rate: np.ndarray
    velocity: np.ndarray
    nz: int

    @property
    def radial_extent(self) -> Tuple[float, float]:
        return self.R.min(), self.R.max()

    @property
    def axial_extent(self) -> Tuple[float, float]:
        return self.Z.min(), self.Z.max()


PLOT_STYLE = PlotStyle()


def log_status(message: str, *, level: str = "INFO") -> None:
Print timestamped status messages for long-running CLI workflows.
    timestamp = datetime.now().strftime("%H:%M:%S")
    print(f"[{timestamp}] [{level}] {message}", flush=True)


def parse_arguments() -> RuntimeConfig:
Parse command-line arguments and construct runtime configuration.
The returned dataclass is immutable and can be safely shared across multiprocessing workers without coordination overhead. This design makes future CLI additions trivial.
Returns: RuntimeConfig: Configuration object containing: - cpus: Number of parallel workers (default: 4) - n_snapshots: Total frames to process (default: 4000) - grids_per_r: Radial mesh resolution (default: 64) - tsnap: Time interval between snapshots (default: 0.01) - Domain bounds (zmin, zmax, rmax) - I/O paths (case_dir, output_dir)
Examples: >>> config = parse_arguments() >>> config.cpus 4 >>> config.bounds DomainBounds(rmin=-4.0, rmax=4.0, zmin=0.0, zmax=4.0)
See Also: RuntimeConfig: Full specification of configuration fields DomainBounds: Domain geometry description
    parser = argparse.ArgumentParser(description="Generate snapshot videos.")
    parser.add_argument("--CPUs", type=int, default=4, help="Number of CPUs to use")
    parser.add_argument(
        "--nGFS", type=int, default=4000, help="Number of restart files to process"
    )
    parser.add_argument(
        "--GridsPerR", type=int, default=256, help="Number of grids per R"
    )
    parser.add_argument("--ZMAX", type=float, default=4.0, help="Maximum Z value")
    parser.add_argument("--RMAX", type=float, default=4.0, help="Maximum R value")
    parser.add_argument("--ZMIN", type=float, default=0.0, help="Minimum Z value")
    parser.add_argument("--tsnap", type=float, default=0.01, help="Time snap")
    parser.add_argument(
        "--caseToProcess",
        type=str,
        default="simulationCases/1000/results",
        help="Case to process",
    )
    parser.add_argument(
        "--folderToSave", type=str, default="simulationCases/1000/results/Video", help="Folder to save"
    )
    parser.add_argument(
        "--skip-video-encode", action="store_true",
        help="Skip ffmpeg video encoding after frame generation"
    )
    parser.add_argument(
        "--framerate", type=int, default=90,
        help="Input framerate for ffmpeg (default: 90)"
    )
    parser.add_argument(
        "--output-fps", type=int, default=30,
        help="Output video framerate (default: 30)"
    )
    args = parser.parse_args()

    return RuntimeConfig(
        cpus=args.CPUs,
        n_snapshots=args.nGFS,
        grids_per_r=args.GridsPerR,
        tsnap=args.tsnap,
        zmin=args.ZMIN,
        zmax=args.ZMAX,
        rmax=args.RMAX,
        case_dir=args.caseToProcess,
        output_dir=args.folderToSave,
        skip_video_encode=args.skip_video_encode,
        framerate=args.framerate,
        output_fps=args.output_fps,
    )


def ensure_directory(path: str) -> None:
Create an output directory if it does not exist.
Parameters: path: Directory to create (including parents).
    if not os.path.isdir(path):
        os.makedirs(path, exist_ok=True)


def run_helper(command: Sequence[str]) -> Sequence[str]:
Run a helper executable and return its stderr as decoded lines.
The compiled helpers deliberately emit their payload to stderr, so stdout is ignored (it is typically empty) and we bubble up informative stderr content.
Parameters: command: Command list passed to subprocess.
Returns: list[str]: Decoded stderr lines produced by the helper.
    process = sp.Popen(command, stdout=sp.PIPE, stderr=sp.PIPE)
    _, stderr = process.communicate()
    if process.returncode != 0:
        raise RuntimeError(
            f"Command {' '.join(command)} failed with code {process.returncode}:\n"
            f"{stderr.decode('utf-8')}"
        )
    return stderr.decode("utf-8").split("\n")


def get_facets(filename: str):
Collect interface facets from getFacet helper with axisymmetric mirroring.
Shells out to the compiled getFacet
executable, which extracts the volume-of-fluid (VOF)
interface as a sequence of line segments. Since the
Basilisk simulation uses axisymmetric coordinates, only
the r ≥ 0 half is computed. This function mirrors each
segment about r=0 to create the full visualization.
Args: filename: Path to Basilisk snapshot file (e.g., ‘snapshot-0.0100’)
Returns: list[tuple]: Sequence of line segments, each as ((r1, z1), (r2, z2)). Each physical segment appears twice: once at +r and once at -r for the mirrored visualization. Empty list if fewer than 100 output lines (likely indicates no interface present).
Note: The getFacet helper outputs space-separated (z, r) pairs. This function swaps to (r, z) convention for matplotlib plotting.
See Also: plot_snapshot: Uses returned segments for LineCollection rendering
    temp2 = run_helper(["postProcess/getFacet", filename])
    segs = []
    skip = False
    if len(temp2) > 1e2:
        for n1 in range(len(temp2)):
            temp3 = temp2[n1].split(" ")
            if temp3 == [""]:
                skip = False
                continue
            if not skip and n1 + 1 < len(temp2):
                temp4 = temp2[n1 + 1].split(" ")
                r1, z1 = np.array([float(temp3[1]), float(temp3[0])])
                r2, z2 = np.array([float(temp4[1]), float(temp4[0])])
                segs.append(((r1, z1), (r2, z2)))
                segs.append(((-r1, z1), (-r2, z2)))
                skip = True
    return segs


def get_field(filename: str, zmin: float, zmax: float, rmax: float, nr: int) -> FieldData:
Read field arrays for a single snapshot from getData-generic helper.
Shells out to the compiled
getData-generic executable, which samples
the velocity and strain-rate fields on a structured
grid. Returns a FieldData struct with reshaped 2D
arrays, abstracting away the flattening scheme used by
the helper.
Args: filename: Path to Basilisk snapshot file (e.g., ‘snapshot-0.0100’) zmin: Minimum axial coordinate for sampling domain zmax: Maximum axial coordinate for sampling domain rmax: Maximum radial coordinate (positive branch only) nr: Number of grid points in radial direction
Returns: FieldData: Structured container with reshaped 2D arrays: - R, Z: Meshgrid coordinates (nz × nr) - strain_rate: Second invariant of rate-of-strain tensor - velocity: Velocity magnitude field - nz: Number of grid points in axial direction (computed)
Note: The helper samples r ∈ [0, rmax], but plotting mirrors about r=0 to create the full axisymmetric visualization.
See Also: FieldData: Structure definition with extent properties plot_snapshot: Uses the returned FieldData for visualization
    temp2 = run_helper(
        [
            "postProcess/getData-generic",
            filename,
            str(zmin),
            str(0),
            str(zmax),
            str(rmax),
            str(nr),
        ]
    )
    Rtemp, Ztemp, D2temp, veltemp = [], [], [], []

    for n1 in range(len(temp2)):
        temp3 = temp2[n1].split(" ")
        if temp3 == [""]:
            continue
        Ztemp.append(float(temp3[0]))
        Rtemp.append(float(temp3[1]))
        D2temp.append(float(temp3[2]))
        veltemp.append(float(temp3[3]))

    R = np.asarray(Rtemp)
    Z = np.asarray(Ztemp)
    D2 = np.asarray(D2temp)
    vel = np.asarray(veltemp)
    nz = int(len(Z) / nr)

    log_status(f"{os.path.basename(filename)}: nz = {nz}")

    R.resize((nz, nr))
    Z.resize((nz, nr))
    D2.resize((nz, nr))
    vel.resize((nz, nr))

    return FieldData(R=R, Z=Z, strain_rate=D2, velocity=vel, nz=nz)


def build_snapshot_info(index: int, config: RuntimeConfig) -> SnapshotInfo:
Construct file paths for a given timestep index.
Parameters: index: Integer index used with
tsnap to recover time. config:
RuntimeConfig providing directories and stride.
Returns: SnapshotInfo: Pre-computed metadata for the worker.
    time = config.tsnap * index
    source = os.path.join(config.case_dir, "intermediate", f"snapshot-{time:.4f}")
    target = os.path.join(config.output_dir, f"{int(time * 1000):08d}.png")
    return SnapshotInfo(index=index, time=time, source=source, target=target)


def draw_domain_outline(ax, bounds: DomainBounds, style: PlotStyle) -> None:
Outline computational domain and symmetry line.
Parameters: ax: Matplotlib axis used for plotting. bounds: Domain extents in both directions. style: Colour/width styling information.
    ax.plot(
        [0, 0],
        [bounds.zmin, bounds.zmax],
        "-.",
        color=style.zero_axis_color,
        linewidth=style.line_width,
    )
    ax.plot(
        [bounds.rmin, bounds.rmin],
        [bounds.zmin, bounds.zmax],
        "-",
        color=style.axis_color,
        linewidth=style.line_width,
    )
    ax.plot(
        [bounds.rmin, bounds.rmax],
        [bounds.zmin, bounds.zmin],
        "-",
        color=style.axis_color,
        linewidth=style.line_width,
    )
    ax.plot(
        [bounds.rmin, bounds.rmax],
        [bounds.zmax, bounds.zmax],
        "-",
        color=style.axis_color,
        linewidth=style.line_width,
    )
    ax.plot(
        [bounds.rmax, bounds.rmax],
        [bounds.zmin, bounds.zmax],
        "-",
        color=style.axis_color,
        linewidth=style.line_width,
    )


def add_colorbar(fig, ax, mappable, *, align: str, label: str, style: PlotStyle):
Attach a vertical colorbar on the requested side of the axis.
Using manual axes lets us keep the main axis square while still showing two distinct colour scales.
Parameters: fig: Figure hosting the axes. ax: Primary axes sharing its bounding box. mappable: The image/artist the colorbar describes. align: ‘left’ or ‘right’ relative to the plotting axis. label: Axis label to display. style: PlotStyle values for spacing and typography.
Returns: matplotlib.colorbar.Colorbar: The constructed colorbar.
    l, b, w, h = ax.get_position().bounds
    if align == "left":
        position = [l - style.left_colorbar_offset, b, style.colorbar_width, h]
    else:
        position = [l + w + style.right_colorbar_offset, b, style.colorbar_width, h]
    cb_ax = fig.add_axes(position)
    colorbar = plt.colorbar(mappable, cax=cb_ax, orientation="vertical")
    colorbar.set_label(label, fontsize=style.tick_label_size, labelpad=5)
    colorbar.ax.tick_params(labelsize=style.tick_label_size)
    colorbar.ax.yaxis.set_major_formatter(StrMethodFormatter("{x:,.2f}"))
    if align == "left":
        colorbar.ax.yaxis.set_ticks_position("left")
        colorbar.ax.yaxis.set_label_position("left")
    return colorbar


def plot_snapshot(
    field_data: FieldData,
    facets,
    bounds: DomainBounds,
    snapshot: SnapshotInfo,
    style: PlotStyle,
) -> None:
Render and persist a single snapshot figure.
All artist construction lives here so multiprocessing workers only need to fetch data and call this function.
Parameters: field_data: Structured arrays for strain-rate and velocity. facets: Line segments representing the interface. bounds: Domain extents that keep axes square. snapshot: Metadata describing time and output file. style: Plotting choices centralised in PlotStyle.
    fig, ax = plt.subplots()
    fig.set_size_inches(*style.figure_size)

    draw_domain_outline(ax, bounds, style)
    line_segments = LineCollection(
        facets, linewidths=4, colors=style.interface_color, linestyle="solid"
    )
    ax.add_collection(line_segments)

    rminp, rmaxp = field_data.radial_extent
    zminp, zmaxp = field_data.axial_extent

    cntrl1 = ax.imshow(
        field_data.strain_rate,
        cmap="hot_r",
        interpolation="Bilinear",
        origin="lower",
        extent=[-rminp, -rmaxp, zminp, zmaxp],
        vmax=2.0,
        vmin=-2.0,
    )

    cntrl2 = ax.imshow(
        field_data.velocity,
        interpolation="Bilinear",
        cmap="Purples",
        origin="lower",
        extent=[rminp, rmaxp, zminp, zmaxp],
        vmax=1.0,
        vmin=0.0,
    )

    ax.set_aspect("equal")
    ax.set_xlim(bounds.rmin, bounds.rmax)
    ax.set_ylim(bounds.zmin, bounds.zmax)
    ax.set_title(f"$t/\\tau_0$ = {snapshot.time:4.3f}", fontsize=style.tick_label_size)
    ax.axis("off")

    add_colorbar(
        fig,
        ax,
        cntrl1,
        align="left",
        label=r"$\left(\boldsymbol{\mathcal{D}:\mathcal{D}}\right)$",
        style=style,
    )
    add_colorbar(
        fig,
        ax,
        cntrl2,
        align="right",
        label=r"$\|\boldsymbol{u}\|$",
        style=style,
    )

    plt.savefig(snapshot.target, bbox_inches="tight")
    plt.close(fig)


def process_timestep(index: int, config: RuntimeConfig, style: PlotStyle) -> None:
Worker executed for every timestep index.
Performs availability checks, loads helper outputs, and calls plot_snapshot.
Parameters: index: Integer timestep index relative to tsnap. config: Runtime configuration shared across workers. style: Plotting style shared by all frames.
    snapshot = build_snapshot_info(index, config)
    if not os.path.exists(snapshot.source):
        log_status(f"Missing: {os.path.basename(snapshot.source)}", level="WARN")
        return
    if os.path.exists(snapshot.target):
        log_status(f"Exists, skipping: {os.path.basename(snapshot.target)}")
        return

    # Show relative path: CaseNo/results/intermediate/filename
    src_parts = snapshot.source.split(os.sep)
    src_rel = os.sep.join(src_parts[-4:]) if len(src_parts) >= 4 else snapshot.source
    log_status(f"Processing {src_rel}")

    try:
        facets = get_facets(snapshot.source)
        nr = int(config.grids_per_r * config.rmax)
        field_data = get_field(
            snapshot.source, config.zmin, config.zmax, config.rmax, nr
        )
        plot_snapshot(field_data, facets, config.bounds, snapshot, style)
    except Exception as err:
        log_status(
            f"Error at {src_rel} (t={snapshot.time:.4f}): {err}", level="ERROR"
        )
        raise

    # Show relative path: CaseNo/results/Video/filename
    tgt_parts = snapshot.target.split(os.sep)
    tgt_rel = os.sep.join(tgt_parts[-4:]) if len(tgt_parts) >= 4 else snapshot.target
    log_status(f"Saved: {tgt_rel}")


def encode_video(config: RuntimeConfig) -> None:
Run ffmpeg to stitch PNG frames into an MP4 video.
The output video is saved in the results directory (parent of Video folder) with the case number as filename (e.g., results/1006.mp4).
Parameters: config: Runtime configuration containing paths and encoding settings.
Raises: RuntimeError: If ffmpeg fails to encode the video.
    # Extract case number from path (e.g., simulationCases/1006/results -> 1006)
    case_no = os.path.basename(os.path.dirname(config.case_dir))

    # Output path: results/1006.mp4 (parent of Video folder)
    output_path = os.path.join(config.case_dir, f"{case_no}.mp4")
    input_pattern = os.path.join(config.output_dir, "*.png")

    cmd = [
        "ffmpeg", "-y",
        "-framerate", str(config.framerate),
        "-pattern_type", "glob",
        "-i", input_pattern,
        "-vf", "pad=ceil(iw/2)*2:ceil(ih/2)*2",
        "-c:v", "libx264",
        "-r", str(config.output_fps),
        "-pix_fmt", "yuv420p",
        output_path
    ]

    log_status(f"Encoding video: {output_path}")
    result = sp.run(cmd, capture_output=True, text=True)
    if result.returncode != 0:
        log_status(f"ffmpeg error: {result.stderr}", level="ERROR")
        raise RuntimeError(f"ffmpeg failed with code {result.returncode}")
    log_status(f"Video saved: {output_path}")


def main():
Entry point used by the documentation tooling and CLI.
    config = parse_arguments()
    ensure_directory(config.output_dir)

    with mp.Pool(processes=config.cpus) as pool:
        worker = partial(process_timestep, config=config, style=PLOT_STYLE)
        pool.map(worker, range(config.n_snapshots))

    # Encode video unless skipped
    if not config.skip_video_encode:
        encode_video(config)


if __name__ == "__main__":
    main()