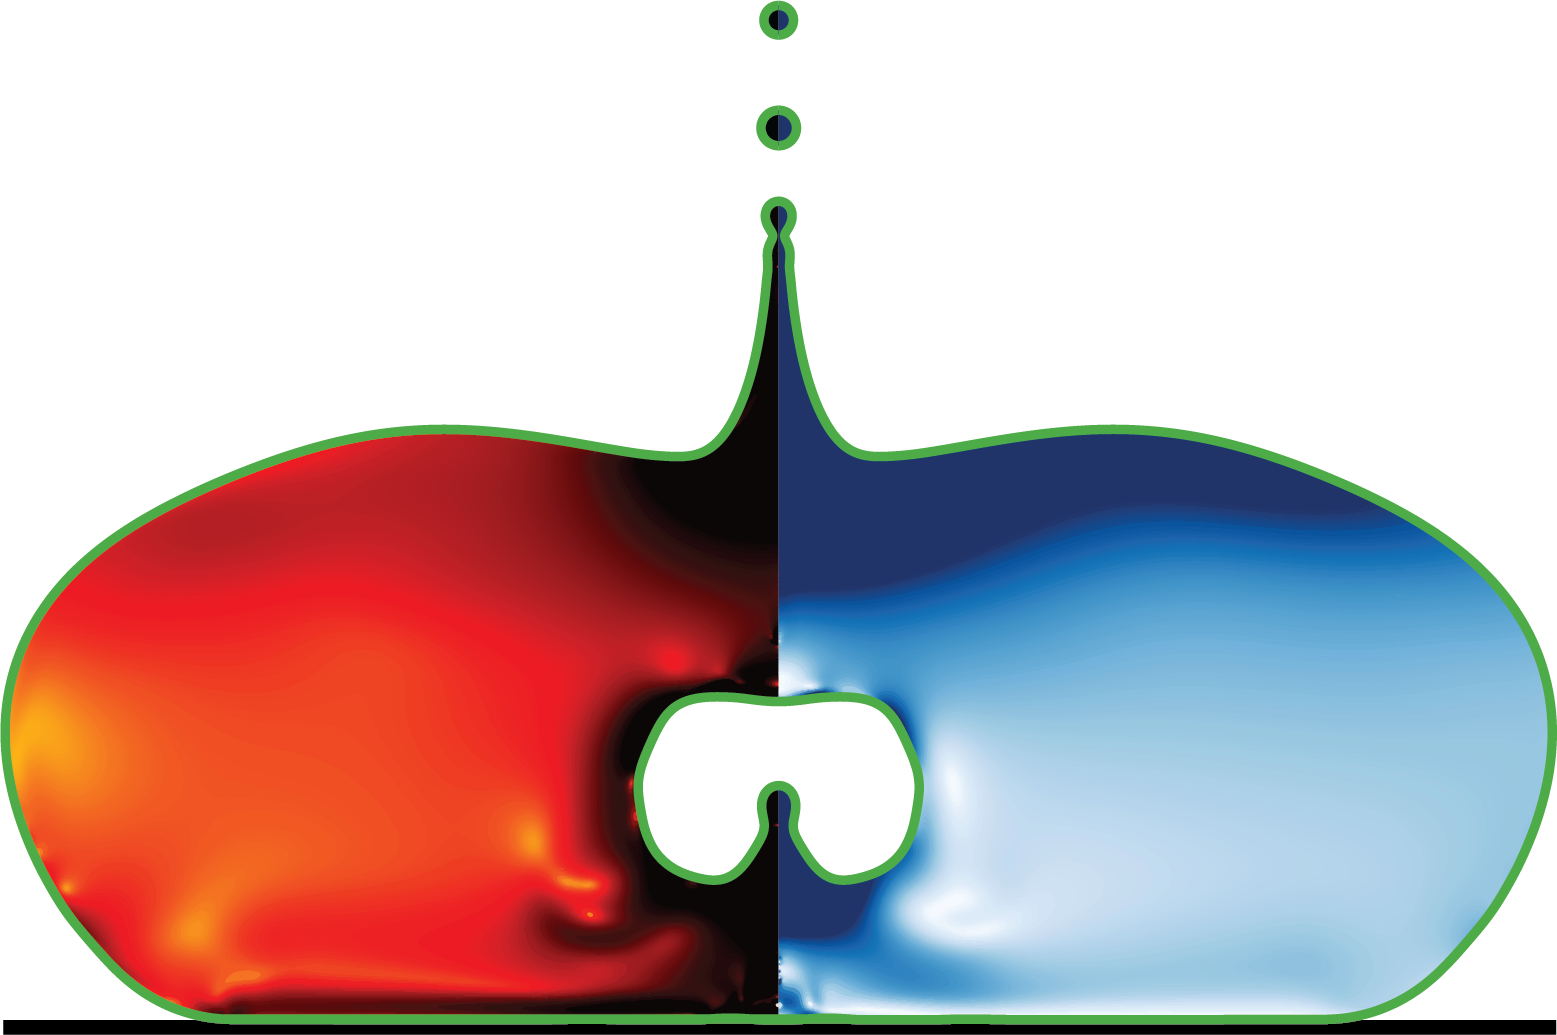
postProcess/VideoBubbleinSheet_03.py
# To get facets for bubbles in sheets

import numpy as np
import os
import subprocess as sp
import matplotlib
import matplotlib.pyplot as plt
from matplotlib.collections import LineCollection
import multiprocessing as mp
from functools import partial
from pathlib import Path
import argparse
from matplotlib.ticker import StrMethodFormatter
import random

import matplotlib.colors as mcolors
custom_colors = ["white", "#8DCDF0"]
custom_cmap = mcolors.LinearSegmentedColormap.from_list("custom_blue", custom_colors)

matplotlib.rcParams['font.family'] = 'serif'
matplotlib.rcParams['text.usetex'] = True
matplotlib.rcParams['text.latex.preamble'] = r'\usepackage{amsmath}'

def gettingFacets(filename, asy):
    exe = ["./getFacet", filename]
    p = sp.Popen(exe, stdout=sp.PIPE, stderr=sp.PIPE)
    stdout, stderr = p.communicate()
    stderr_output = stderr.decode("utf-8")
    points = stderr_output.split("\n")
    segments = []

    if len(points) > 100:
        for i in range(len(points) - 1):
            current_point = points[i].split()
            if current_point:
                next_point = points[i + 1].split()
                if next_point:
                    r1, z1 = float(current_point[1]), float(current_point[0])
                    r2, z2 = float(next_point[1]), float(next_point[0])
                    if asy:
                        segment_variants = [
                                ((r1, z1), (r2, z2)),
                                ((-r1, z1), (-r2, z2))
                            ]
                    else:
                        segment_variants = [
                            ((r1, z1), (r2, z2)),
                            ((-r1, z1), (-r2, z2)),
                            ((r1, -z1), (r2, -z2)),
                            ((-r1, -z1), (-r2, -z2))
                        ]

                    segments.extend(segment_variants)
    return segments

def gettingfield(filename, zmin, rmin, zmax, rmax, nr, Oh):
    exe = ["./getData_02", filename, str(zmin), str(rmin), str(zmax), str(rmax), str(nr), str(Oh)]
    p = sp.Popen(exe, stdout=sp.PIPE, stderr=sp.PIPE)
    stdout, stderr = p.communicate()
    lines = stderr.decode("utf-8").split("\n")
    Rtemp, Ztemp, D2temp, veltemp, Utemp, Vtemp = [],[],[],[],[],[]

    for i in range(len(lines)):
        values = lines[i].split(" ")
        if values == ['']:
            pass
        else:
            Ztemp.append(float(values[0]))
            Rtemp.append(float(values[1]))
            D2temp.append(float(values[2]))
            veltemp.append(float(values[3]))
            Utemp.append(float(values[4]))
            Vtemp.append(float(values[5]))

    R = np.asarray(Rtemp)
    Z = np.asarray(Ztemp)
    D2 = np.asarray(D2temp)
    vel = np.asarray(veltemp)
    U = np.asarray(Utemp)
    V = np.asarray(Vtemp)
    nz = int(len(Z)/nr)


    # print(f"nz is {nz}")

    R.resize((nz, nr))
    Z.resize((nz, nr))
    D2.resize((nz, nr))
    vel.resize((nz, nr))
    U.resize((nz, nr))
    V.resize((nz, nr))

    return R, Z, D2, vel, U, V, nz


def process_timestep(ti, folder, rmin, rmax, zmin, zmax, lw, asy, Oh, nr, Ldomain):
t = 0.01*ti
snapshot_file = Path(f"intermediate/snapshot-{t:.4f}")
output_file = folder / f"{int(t * 1000):08d}.png"
if not snapshot_file.exists():
print(f"{snapshot_file} not found!")
return
if output_file.exists():
print(f"{output_file} already present!")
return
segs = gettingFacets(snapshot_file, asy)
if not segs:
print(f"Problem in the available file {snapshot_file}")
return
R, Z, D2, vel, U, V, nz = gettingfield(snapshot_file, zmin, rmin, zmax, rmax, nr, Oh)
# Part to plot
AxesLabel, TickLabel = [50, 35]
fig, ax = plt.subplots()
fig.set_size_inches(19.20, 10.80)
if not asy:
rmin, rmax, zmin, zmax = 0, Ldomain, -1.5, 1.5
ax.plot([0, 0], [zmin, zmax],'-.',color='grey',linewidth=lw)
ax.plot([-rmax, -rmax], [zmin, zmax],'-',color='black',linewidth=lw)
ax.plot([-rmax, rmax], [zmin, zmin],'-',color='black',linewidth=lw)
ax.plot([-rmax, rmax], [zmax, zmax],'-',color='black',linewidth=lw)
ax.plot([rmax, rmax], [zmin, zmax],'-',color='black',linewidth=lw)
## Copied Lines
ax.set_aspect('equal')
ax.set_xlim(-rmax, rmax)
ax.set_ylim(zmin, zmax)
velmax, velmin = np.max(vel), np.min(vel)
# velmax, velmin = 1.5, 1e-3
# d2max, d2min = np.max(D2), np.min(D2)
d2max, d2min = np.max(vel), np.min(vel)
# print(f"max D2 is {d2max} and min D2 is {d2min}")
# print(f"max vel is {velmax} and min vel is {velmin}")
if asy:
cntrl1 = ax.imshow(vel, cmap="Blues", interpolation='Bilinear', origin='lower', extent=[rmin, -rmax, zmin, zmax], vmax=velmax, vmin=velmin)
cntrl2 = ax.imshow(D2, cmap="hot_r", interpolation='Bilinear', origin='lower', extent=[rmin, rmax, zmin, zmax], vmax=d2max, vmin=d2min)
else:
rmin, rmax, zmin, zmax = 0, Ldomain, 0, Ldomain/2
cntrl1 = ax.imshow(vel, cmap=custom_cmap, interpolation='Bilinear', origin='lower', extent=[rmin, -rmax, zmin, zmax], vmax=velmax, vmin=velmin)
cntrl2 = ax.imshow(vel, cmap=custom_cmap, interpolation='Bilinear', origin='lower', extent=[rmin, rmax, zmin, zmax], vmax=d2max, vmin=d2min)
cntrl1 = ax.imshow(vel, cmap=custom_cmap, interpolation='Bilinear', origin='lower', extent=[rmin, -rmax, zmin, -zmax], vmax=velmax, vmin=velmin)
cntrl2 = ax.imshow(vel, cmap=custom_cmap, interpolation='Bilinear', origin='lower', extent=[rmin, rmax, zmin, -zmax], vmax=d2max, vmin=d2min)
## Drawing Facets
line_segments = LineCollection(segs, linewidths=3.25, colors='black', linestyle='solid')
ax.add_collection(line_segments)
ax.set_title(f'$t/\\tau_\gamma$ = {t:.1f}', fontsize=TickLabel)
# l, b, w, h = ax.get_position().bounds
# cb1 = fig.add_axes([l+0.05*w, b-0.05, 0.40*w, 0.03])
# c1 = plt.colorbar(cntrl1,cax=cb1,orientation='horizontal')
# c1.set_label(r'$\|\mathbf{v}\|/\sqrt{\gamma/\rho R_0}$',fontsize=TickLabel, labelpad=-25)
# c1.ax.tick_params(labelsize=TickLabel)
# c1.ax.xaxis.set_major_formatter(StrMethodFormatter('{x:,.3f}'))
# c1.set_ticks([velmax, velmin])
# cb2 = fig.add_axes([l+0.55*w, b-0.05, 0.40*w, 0.03])
# c2 = plt.colorbar(cntrl2,cax=cb2,orientation='horizontal')
# c2.ax.tick_params(labelsize=TickLabel)
# c2.set_label(r"$\log_{10}\left(2 Oh \left( \boldsymbol{\mathcal {D} : \mathcal {D}} \right) \right)$",fontsize=TickLabel, labelpad=-25)
# c2.ax.xaxis.set_major_formatter(StrMethodFormatter('{x:,.1f}'))
# c2.set_ticks([d2max, d2min])
ax.axis('off')
# plt.show()
plt.savefig(output_file, bbox_inches="tight", dpi=250)
plt.close()
print(f"{ti+1} is done")def main(): parser = argparse.ArgumentParser(description=“Process facets for bubbles in sheets.”) parser.add_argument(‘–asy’, action=‘store_true’, help=“If set, use asymmetric variants. Default is false.”) parser.add_argument(‘–Oh’, type=float, default=0.01, help=“Oh value.”) args = parser.parse_args()
nGFS = 10000
Ldomain = 4
GridsPerR = 64
nr = int(GridsPerR*Ldomain)

if args.asy:
    rmin, rmax, zmin, zmax = 0, Ldomain, -Ldomain/2, Ldomain/2
else:
    rmin, rmax, zmin, zmax = 0, Ldomain, 0, Ldomain/2
lw = 2

folder = Path('Video_02')  # output folder

if not folder.is_dir():
    os.makedirs(folder)

# Prepare the partial function with fixed arguments
# process_func = partial(process_timestep, folder=folder, rmin=rmin, rmax=rmax, zmin=zmin, zmax=zmax, lw=lw, asy=args.asy, nr=nr)
process_func = partial(process_timestep, folder=folder, rmin=rmin, rmax=rmax, zmin=zmin, zmax=zmax, lw=lw, asy=args.asy, Oh=args.Oh, nr=nr, Ldomain=Ldomain)

# Use all available CPU cores
num_processes = 3 #mp.cpu_count()

nGFS_list = list(range(nGFS))
random.shuffle(nGFS_list)

# Create a pool of worker processes
with mp.Pool(processes=num_processes) as pool:
    # Map the process_func to all timesteps
    pool.map(process_func, nGFS_list)
if name == “main”: main()