11 · Read a Basilisk log
This lab joins the core ideas: a named schema, validated arrays, a reduction, tests, a CLI, and a figure.
Question: when does kinetic energy plateau while the minimum scale continues to shrink?
Output: a JSON evidence record and a deterministic two-panel figure.
The supplied data are synthetic. They mimic a Basilisk-style diagnostic log and do not encode an unpublished run.
Frame
Inspect the first rows:
The contract is documented in data/README.md.
Write down:
- expected sample count;
- time range and spacing;
- valid signs for every quantity;
- a numerical definition of “plateau”;
- whether shrinking \(h_{\min}\) is compatible with steady kinetic energy.
The final question is physical. The program can report trends; it cannot decide their interpretation without a model.
Predict
Before plotting:
- energy should rise and approach approximately 0.194;
- \(h_{\min}\) should remain positive and decrease;
- the two arrays should share the time shape;
- a four-sample, three-per-cent window should eventually detect a plateau.
Build: validate once
Inspect:
Now break a copy:
Make one time repeat and run:
The reader should stop before reduction.
Build: reduce to evidence
The output is machine-readable:
{
  "samples": 16,
  "final_time": 0.75,
  "peak_kinetic_energy": 0.194,
  "minimum_length": 0.073,
  "steady_from_time": 0.65
}
Do not trust this block merely because the course printed it. Read
summarise_log and calculate the accepted rolling window.
The steady time is not a universal physical event. It depends on the declared window and tolerance. Record those values if the result enters a paper.
Build: make the argument visible
Inspect:
- are both \(y\)-axes logarithmic for a reason?
- are all values legal on those axes?
- is the shared time axis clear?
- would normalising time by \(t_\sigma\) improve comparison across cases?
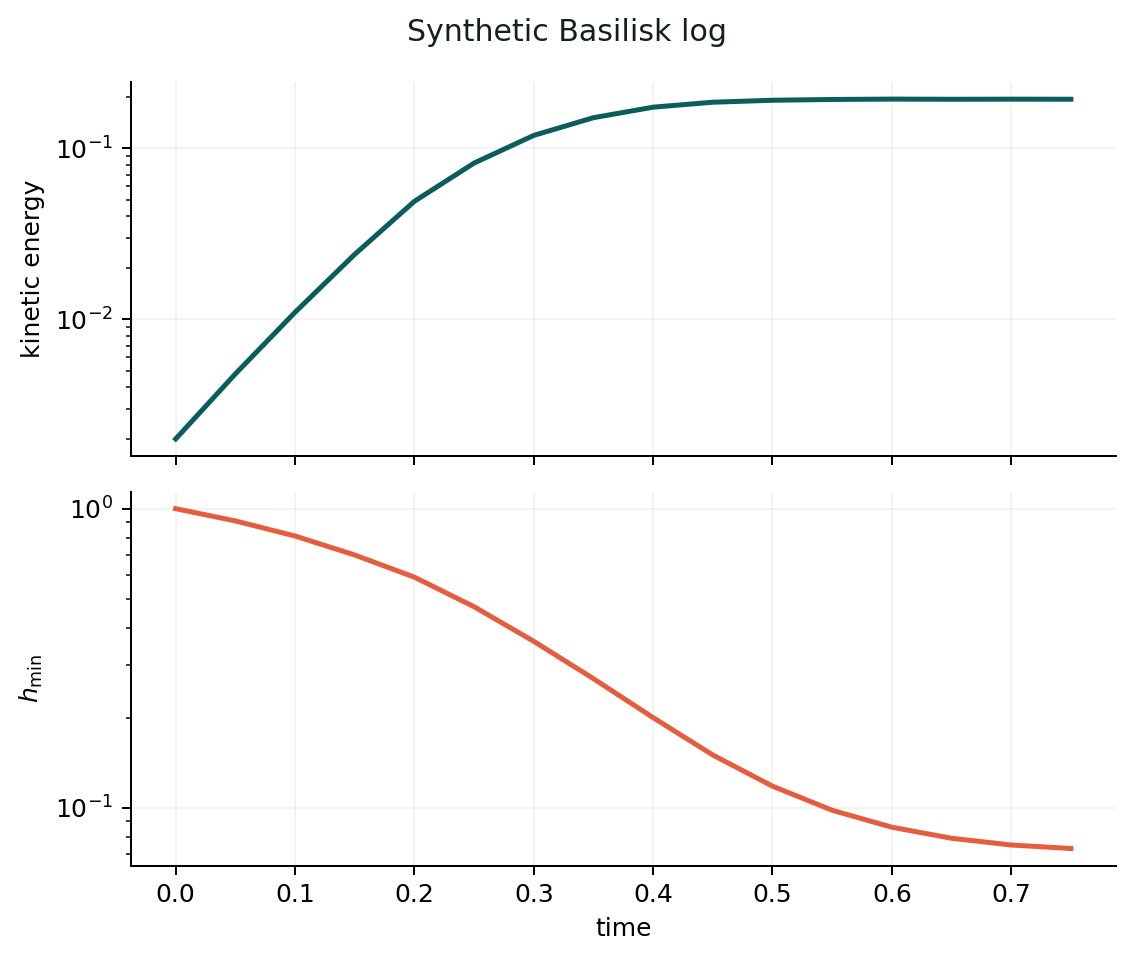
data/basilisk_log.csv; the trend supports a numerical statement, while its physical interpretation remains model-dependent.Verify
Complete Exercise 11, then run the targeted reference tests:
Inspect the regression test that establishes:
a log with negative kinetic energy must fail and name the violated column.
Useful evidence layers are:
- schema test;
- range and ordering invariants;
- reduction regression;
- figure-output smoke test;
- visual and physical interpretation.
Extend
Add a command:
It should:
- compute \(dh_{\min}/dt\);
- save a reduced CSV with
t,h_min,dh_min_dt; - state the finite-difference assumption;
- refuse a non-uniform grid or use an algorithm that supports it;
- include an analytic test independent of the simulation data.
HPC boundary
A real Basilisk workflow may contain thousands of snapshots:
Run extractors across independent snapshots on an allocated compute node. Gather reduced rows, sort by time, validate the schema, then plot. Never launch a multiprocessing sweep on the login node.
Reflect
The log became evidence only after three questions were separated:
- Does the file obey its contract?
- Does the numerical reduction behave as claimed?
- What physical statement does the trend support?
Do not compress those into “the plot looks right”.